📌 这节课讲了什么
这节课把写作 Task 1 里最常见的几类图连着过了一遍:
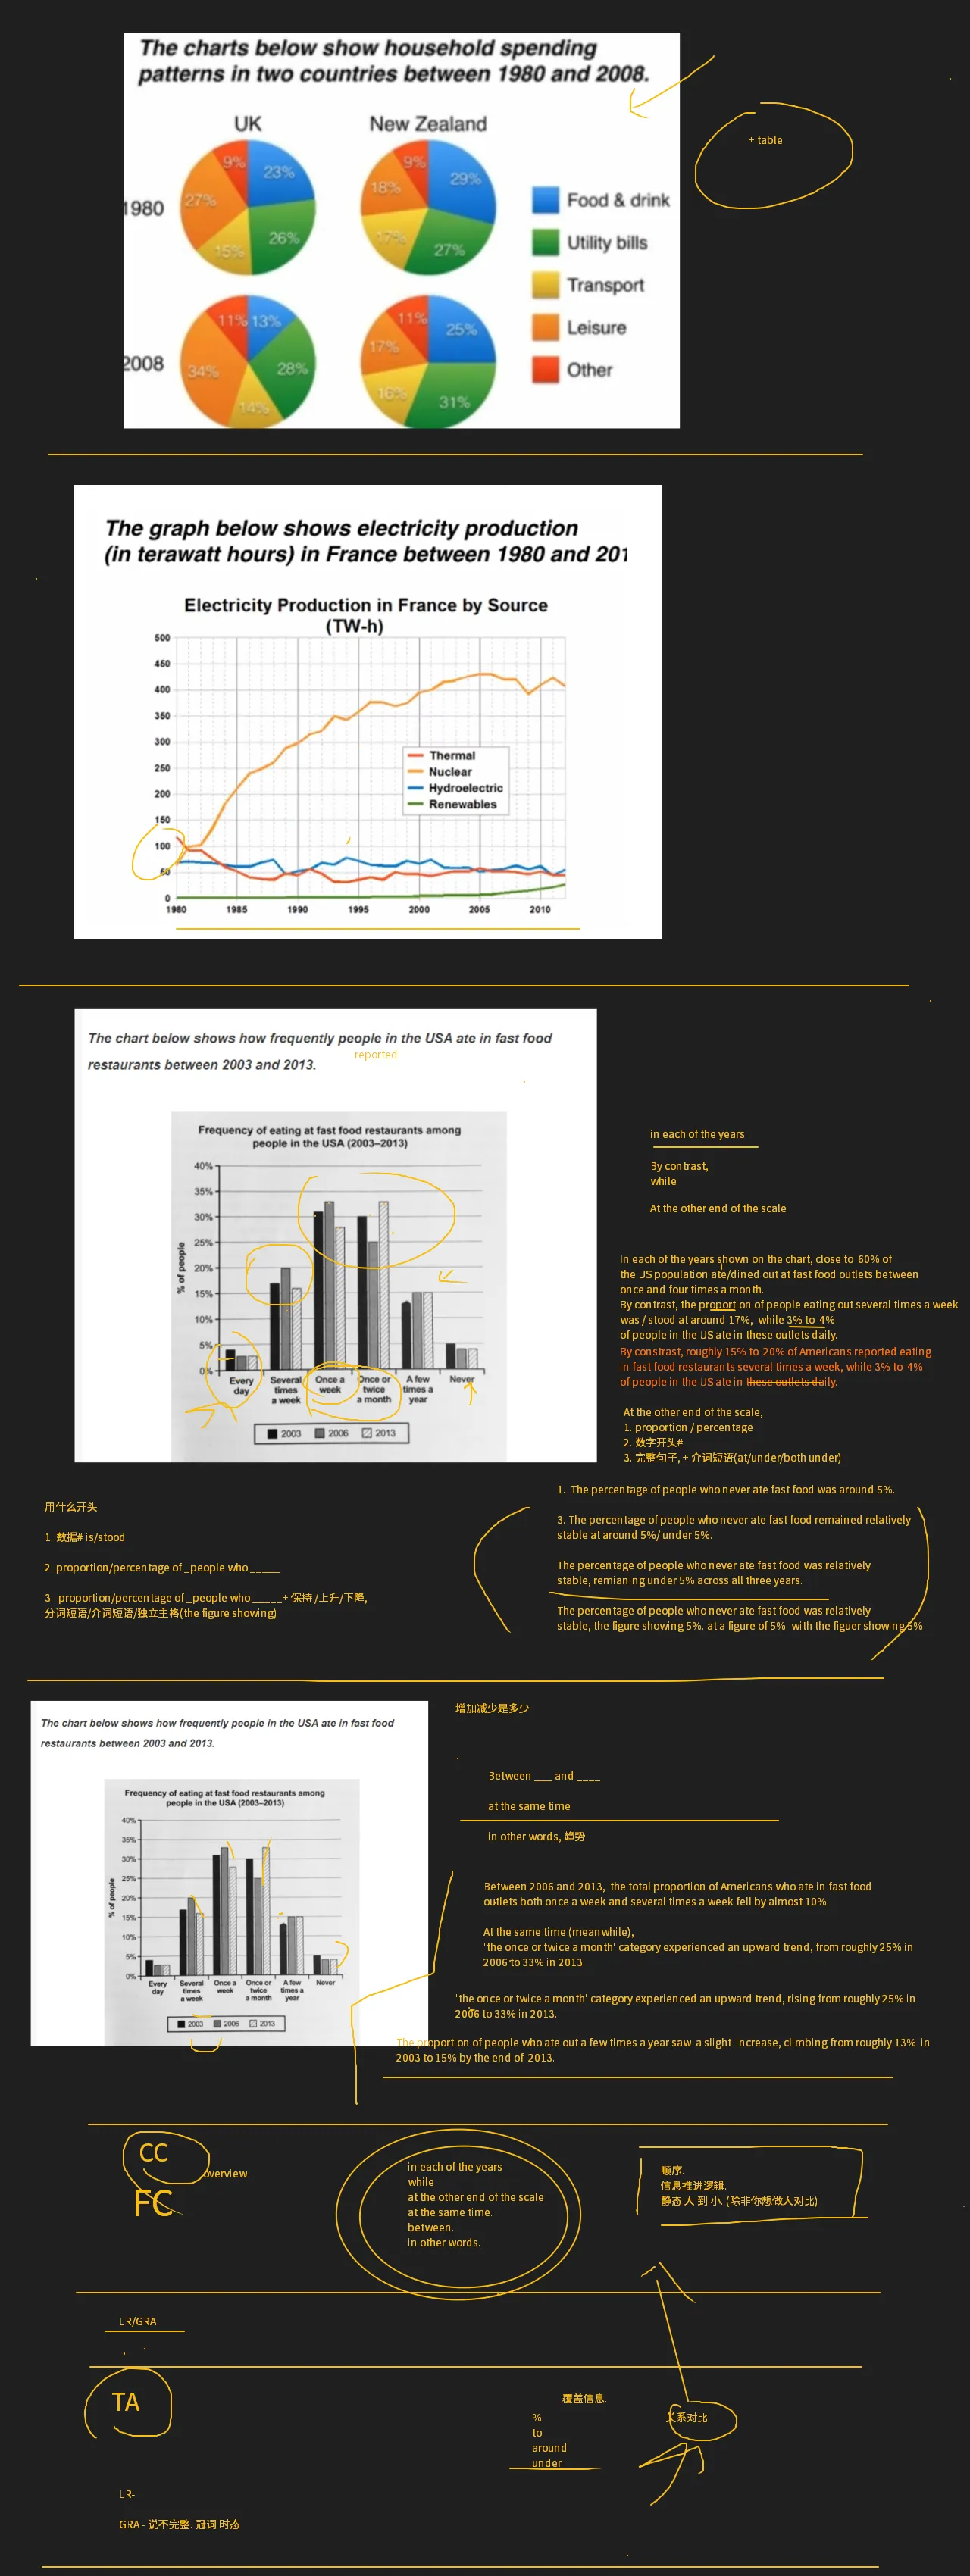
- 饼图 —— household spending patterns in two countries,两个国家 × 两个年份;
- 折线图 —— electricity production in France,这是这节课的重头,从开头句一路练到收尾句;
- 柱状图 —— how frequently people in the USA ate in fast food restaurants,练「句子用什么开头」和「增加减少是多少」。
贯穿全课的两个问题只有一个:这句数据句用什么开头,以及变化了多少、怎么把变化说出来。板书上反复圈出的连接词(in each of the years / while / at the other end of the scale / at the same time / between / in other words)就是让整篇文章「信息推进」而不是「信息罗列」的骨架。
📝 三张图长什么样
图一:饼图
The charts below show household spending patterns in two countries between 1980 and 2008.
UK 和 New Zealand 各两个饼(1980 / 2008),图例五类:
| 英文 | 中文 |
|---|---|
| Food & drink | 食品饮料 |
| Utility bills | 水电煤账单 |
| Transport | 交通 |
| Leisure | 休闲 |
| Other | 其他 |
板书在题目旁边圈了一句 + table —— 意思是这种饼图题,数据可以另外整理成表格来对比,先把「象限」摆清楚再动笔。
图二:折线图
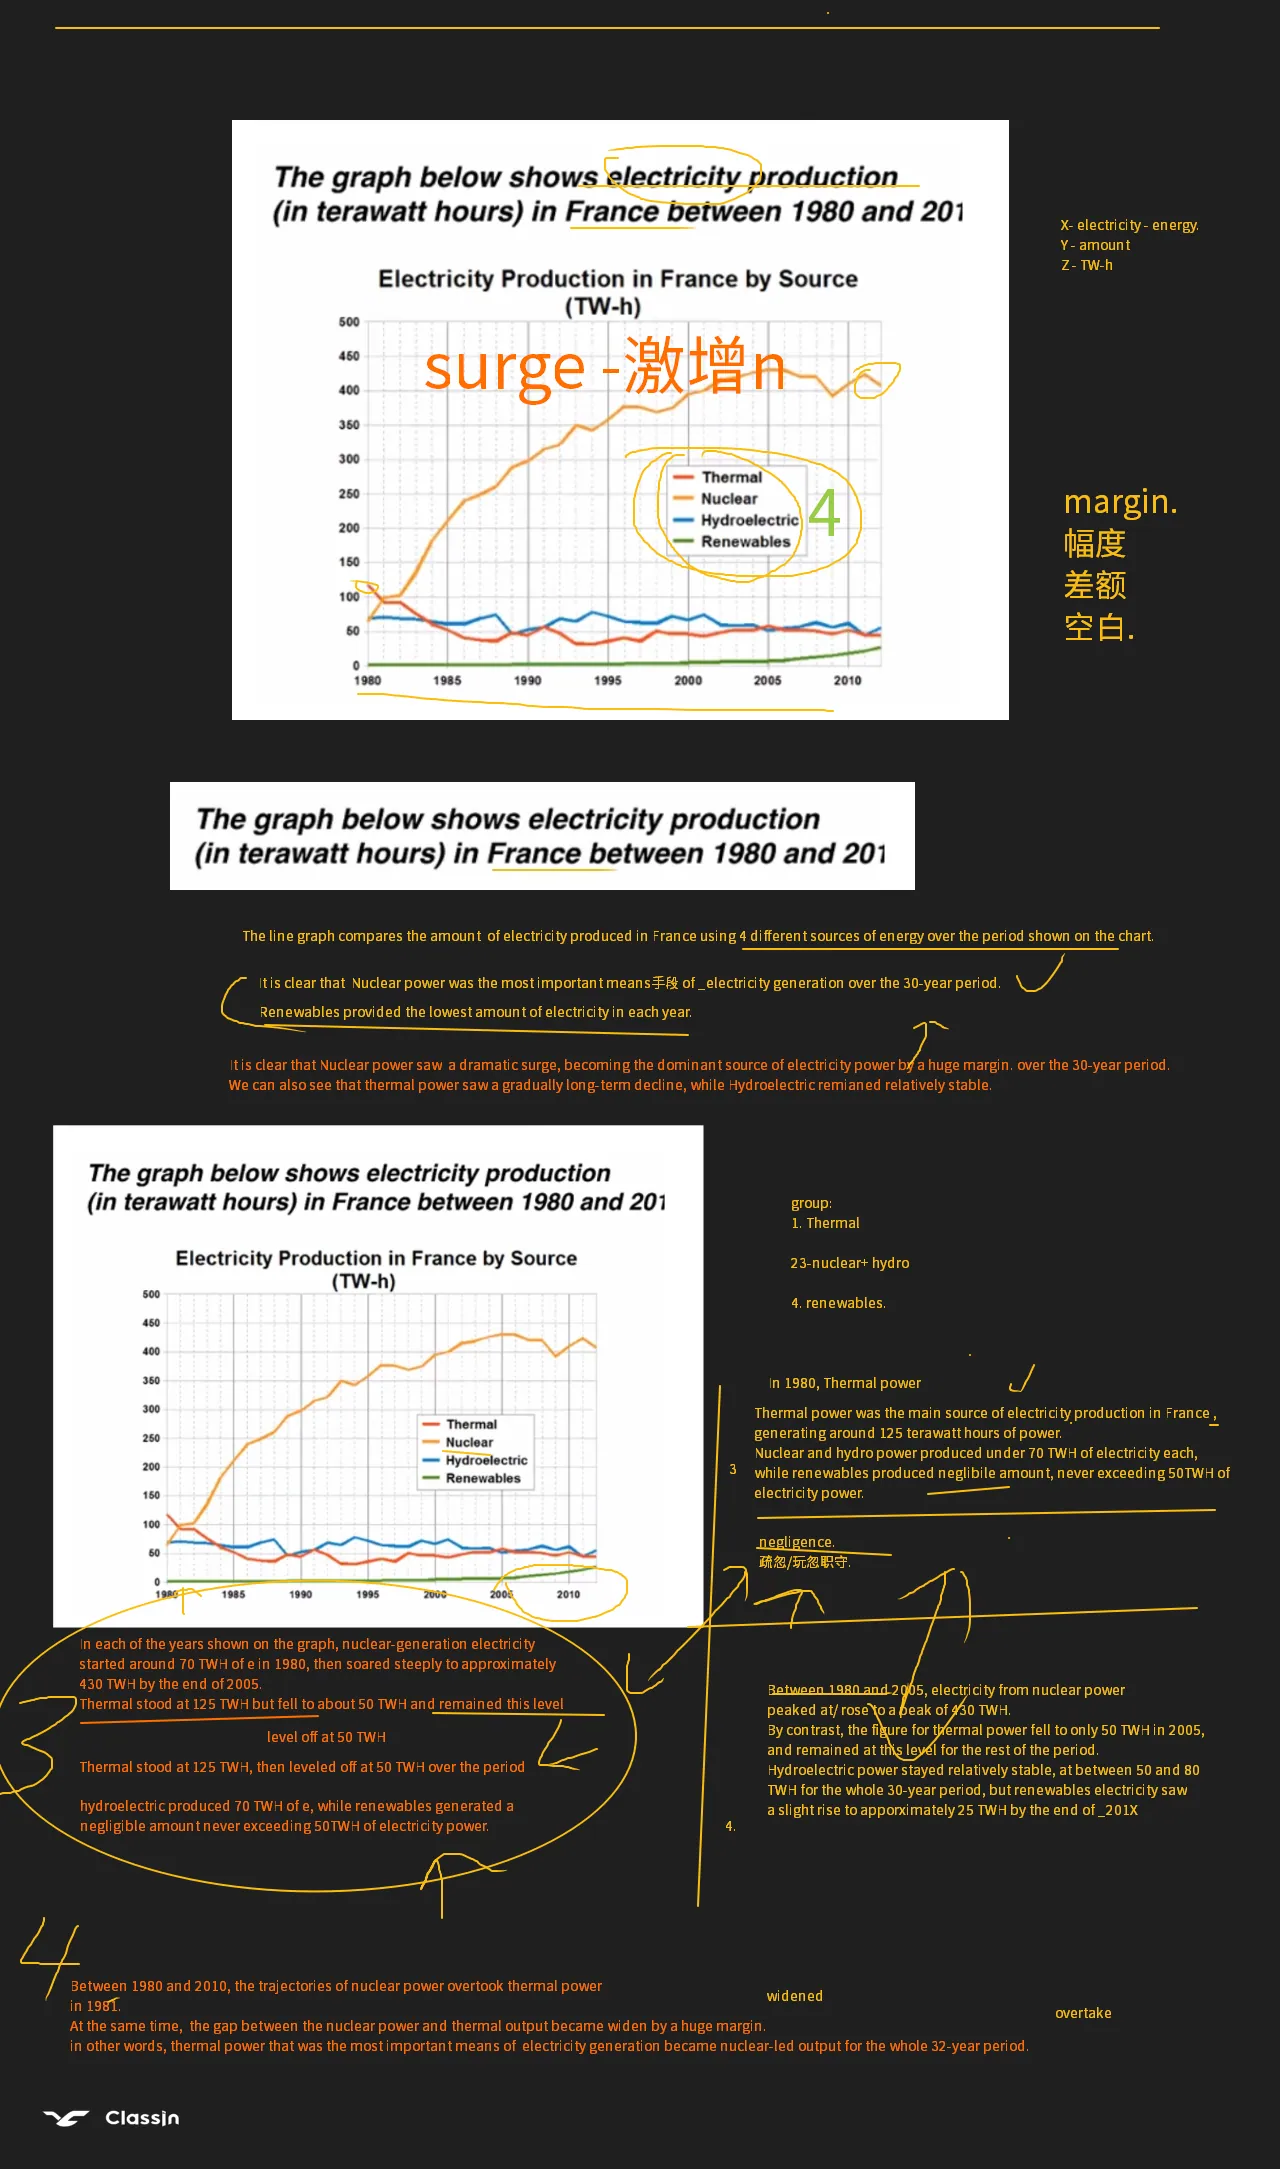
The graph below shows electricity production (in terawatt hours) in France between 1980 and 201
图上的标题是 Electricity Production in France by Source (TW-h),四条线:
Thermal / Nuclear / Hydroelectric / Renewables
板书在 Nuclear 那条陡峭上升的线旁边写了 surge - 激增,并在图例旁边圈了个 4 —— 四条线,四个 source,千万别漏掉 renewables 这条几乎贴地的线。
右侧三个坐标轴的读法:
x- electricity- energy. Y- amount Z- TW-h
以及一个关键词:
margin. 幅度 差额 空白.
图三:柱状图
The chart below shows how frequently people in the USA ate in fast food restaurants between 2003 and 2013.
图上标题是 Frequency of eating at fast food restaurants among people in the USA (2003–2013),纵轴 % of people,横轴六档频率:
Every day / Several times a week / Once a week / Once or twice a month / A few times a year / Never
三根柱子对应 2003 / 2006 / 2013。
板书在题目里的 ate in 上面补了一个词 —— reported,提醒这句更稳的说法是 people in the USA reported eating in fast food restaurants。
🧱 方法:句子用什么开头
板书左侧专门列了这一栏:
| 开头方式 | 说明 |
|---|---|
| 1. 数据# is/stood | 直接把数字顶到句首,后接 is / stood |
| 2. proportion / percentage of _ people who ___ | 用比例做主语,后面挂定语从句 |
| 3. proportion / percentage of _ people who ___ + 保持 / 上升 / 下降 | 在 2 的基础上加趋势 |
第 3 种后面再接一个收尾成分,板书写了三种可选:
- 分词短语
- 介词短语
- 独立主格(the figure showing)
板书用同一个意思,把这三种收尾各写了一遍:
The percentage of people who never ate fast food was relatively stable, remaining under 5% across all three years.(分词短语)
The percentage of people who never ate fast food was relatively stable, at a figure of 5%.(介词短语)
The percentage of people who never ate fast food was relatively stable, the figure showing 5%.(独立主格)
同一个意思还可以换 with 引导:
... was relatively stable, with the figure showing 5%.
还有更省事的版本,直接把趋势句压进去:
The percentage of people who never ate fast food remained relatively stable at around 5% / under 5%.
🧱 方法:数据怎么串起来
板书右下角是「信息推进」的两种关系:
覆盖信息(把范围说全,避免漏项):% / to / or / around / under
3% to 4%—— 用 to 给区间around 5%—— 大约under 5%—— 不到once and four times a month—— 用 or 把相邻项并起来
关系对比(把两组数据拉到一起说):by contrast / while / at the other end of the scale
顺序原则,板书原话:
顺序. 信息推进逻辑. 静态大到小.(除非你想做大对比)
也就是说:静态图按从大到小排;动态图按时间或趋势排;除非你要做大对比,否则不要乱跳。
连接词清单(板书用圆圈圈起来的那一组):
- in each of the years
- while
- at the other end of the scale
- at the same time.
- between.
- in other words.
💬 可套用的句式(柱状图)
开头句 —— 用 compare 起手:
The line graph compares the amount of electricity produced in France using 4 different sources of energy over the period shown on the chart.
概述句 —— 两句一组,一句说最大,一句说最小:
It is clear that Nuclear power was the most important means of electricity generation over the 30-year period.
Renewables provided the lowest amount of electricity in each year.
换成带趋势的写法:
It is clear that Nuclear power saw a dramatic surge, becoming the dominant source of electricity power by a huge margin, over the 30-year period.
We can also see that thermal power saw a gradually long-term decline, while Hydroelectric remained relatively stable.
数据句 —— 先占位,再补数
In 1980, Thermal power was the main source of electricity production in France, generating around 125 terawatt hours of power.
Nuclear and hydro power produced under 70 TWH of electricity each, while renewables produced negligible amount, never exceeding 50 TWH of electricity power.
同一个意思,换三种趋势词
| 说法 | 板书原句 |
|---|---|
| 起点 + 陡升 | In each of the years shown on the graph, nuclear-generation electricity started around 70 TWH of e in 1980, then soared steeply to approximately 430 TWH by the end of 2005. |
| 起点 + 回落 + 持平 | Thermal stood at 125 TWH but fell to about 50 TWH and remained this level at 50 TWH over the period. |
| 起点 + 持平 | Thermal stood at 125 TWH, then leveled off at 50 TWH over the period. |
峰值 / 谷值怎么搭
Between 1980 and 2005, electricity from nuclear power peaked at / rose to a peak of 430 TWH.
By contrast, the figure for thermal power fell to only 50 TWH in 2005, and remained at this level for the rest of the period.
Hydroelectric power stayed relatively stable, at between 50 and 80 TWH for the whole 30-year period, but renewables electricity saw a slight rise to approximately 25 TWH by the end of 201X.
交叉 / 反超
Between 1980 and 2010, the trajectories of nuclear power overtook thermal power in 1981.
At the same time, the gap between the nuclear power and thermal output became widened by a huge margin.
in other words, thermal power that was the most important means of electricity generation became nuclear-led output for the whole 32-year period.
💬 可套用的句式(柱状图)
写最大那块
In each of the years shown on the chart, close to 60% of the US population ate/dined out at fast food outlets between once and four times a month.
对比着写
By contrast, the proportion of people eating out several times a week was / stood at around 17%, while 3% to 4% of people in the US ate in these outlets daily.
By contrast, roughly 15% to 20% of Americans reported eating in fast food restaurants several times a week, while 3% to 4% of people in the US ate in these outlets daily.
写到另一端
At the other end of the scale, 1. proportion / percentage 2. 数字开头# 3. 完整句子,+ 介词短语(at / under / both under)
按这三步落笔:
The percentage of people who never ate fast food was around 5%.
「减少/增加是多少」怎么写
- 主语是两档合并时,用 both ... and ...:
Between 2006 and 2013, the total proportion of Americans who ate in fast food outlets both once a week and several times a week fell by almost 10%.
- 说某一档上升,两种写法都行 —— 名词趋势 / 现在分词:
At the same time (meanwhile), the 'once or twice a month' category experienced an upward trend, from roughly 25% in 2006 to 33% in 2013.
'the once or twice a month' category experienced an upward trend, rising from roughly 25% in 2006 to 33% in 2013.
- 小幅上升用 slight increase:
The proportion of people who ate out a few times a year saw a slight increase, climbing from roughly 13% in 2003 to 15% by the end of 2013.
📖 词汇与表达
| 英文 | 中文 | 搭配 / 用法 |
|---|---|---|
| means | 手段、方式 | the most important means of electricity generation |
| surge | 激增 | Nuclear power saw a dramatic surge |
| soar | 陡升 | soared steeply to approximately 430 TWH |
| peak at / rise to a peak of | 达到峰值 | peaked at 430 TWH |
| level off at | 走平、稳定在 | leveled off at 50 TWH |
| stand at | (数字)停在 | Thermal stood at 125 TWH |
| trajectory | 轨迹、走势 | the trajectories of nuclear power |
| overtake | 反超 | overtook thermal power in 1981 |
| gap | 差距 | the gap between ... became widened |
| widen | 拉大 | widened by a huge margin |
| margin | 幅度、差额 | by a huge margin |
| negligible | 微不足道的 | produced negligible amount |
| negligence | 疏忽 / 玩忽职守 | 板书给的中文注释 |
| exceed | 超过 | never exceeding 50 TWH |
| dominate / dominant | 主导 | the dominant source of electricity |
| decline | 下降 | a gradually long-term decline |
| slight rise / slight increase | 小幅上升 | saw a slight rise to approximately 25 TWH |
| upward trend | 上升趋势 | experienced an upward trend |
| remainder / remaining | 保持、余下 | remaining under 5% across all three years |
| dine out | 外出吃饭 | ate / dined out at fast food outlets |
| outlet | 门店 | fast food outlets |
| utility bills | 水电煤账单 | 饼图里的第二类 |
| household spending patterns | 家庭支出结构 | 饼图题目原话 |
| figure | 数字 | at a figure of 5% / the figure for thermal power |
⚠️ 提醒 / 易错
1. 数字前面选对词。 板书专门标了「覆盖信息」的五个小词:% / to / or / around / under。区间用 to,约数用 around,不到用 under,相邻项并列用 or。别整篇只会写一个 about。
2. 一句话里「趋势 + 数值 + 时间」三件套要齐。 板书里被划掉的错句就是缺件:
~~Thermal stood at 125 TWH but fell to about 50 TWH and remained this level~~
改成:
Thermal stood at 125 TWH, then leveled off at 50 TWH over the period.
缺的正是那个介词 —— remain / level off 后面要接 at。
3. 时态和冠词。 板书最后一行自我诊断写着 GRA - 说不完整. 冠词时态。折线图跨 1980–2010,主体用过去时;说「到某年为止达到」用 by the end of + 年份,那句的时态要跟着走。
4. 单复数。 主语是 proportion / percentage 时,谓语跟比例走(单数);主语换成 people / Americans 时,谓语用复数。板书同一组句子里 the proportion ... was 和 3% to 4% of people ... ate 是并排出现的,对照着看。
5. 别丢线。 折线图四条线(renewables 几乎贴着底面)、柱状图三根柱、饼图 1980 和 2008 两个年份 —— 板书在图例旁圈的 4 和饼图旁的 + table 都是在提醒:先数清楚有几项,再动笔。